
Watching traffic
Choose a monitoring view and check what its data covers in the standard edition. For step-by-step checks, see common tasks; for the smaller edition, see doona lite.
| What you need | Where to look |
|---|---|
| Current traffic and engine health | Activity |
| Backend version, warnings or a missing feature | System status |
| A live connection's route | Connections |
| Recorded routing decisions | Routing log |
| DNS answers, cache or resolution history | DNS |
| Engine messages | Logs |
| Configuration and runtime events | Events |
Activity
Activity combines traffic, connection, latency and system cards. If setup is incomplete, Getting started links to the remaining setup tasks; use the tutorial to complete them.
Each step completes automatically when its condition is met:
- A subscription or proxy node exists.
- Routing has been chosen.
- A group's selected proxy node has a successful latency result.
Completing all steps or dismissing the card hides it; this browser remembers that state.
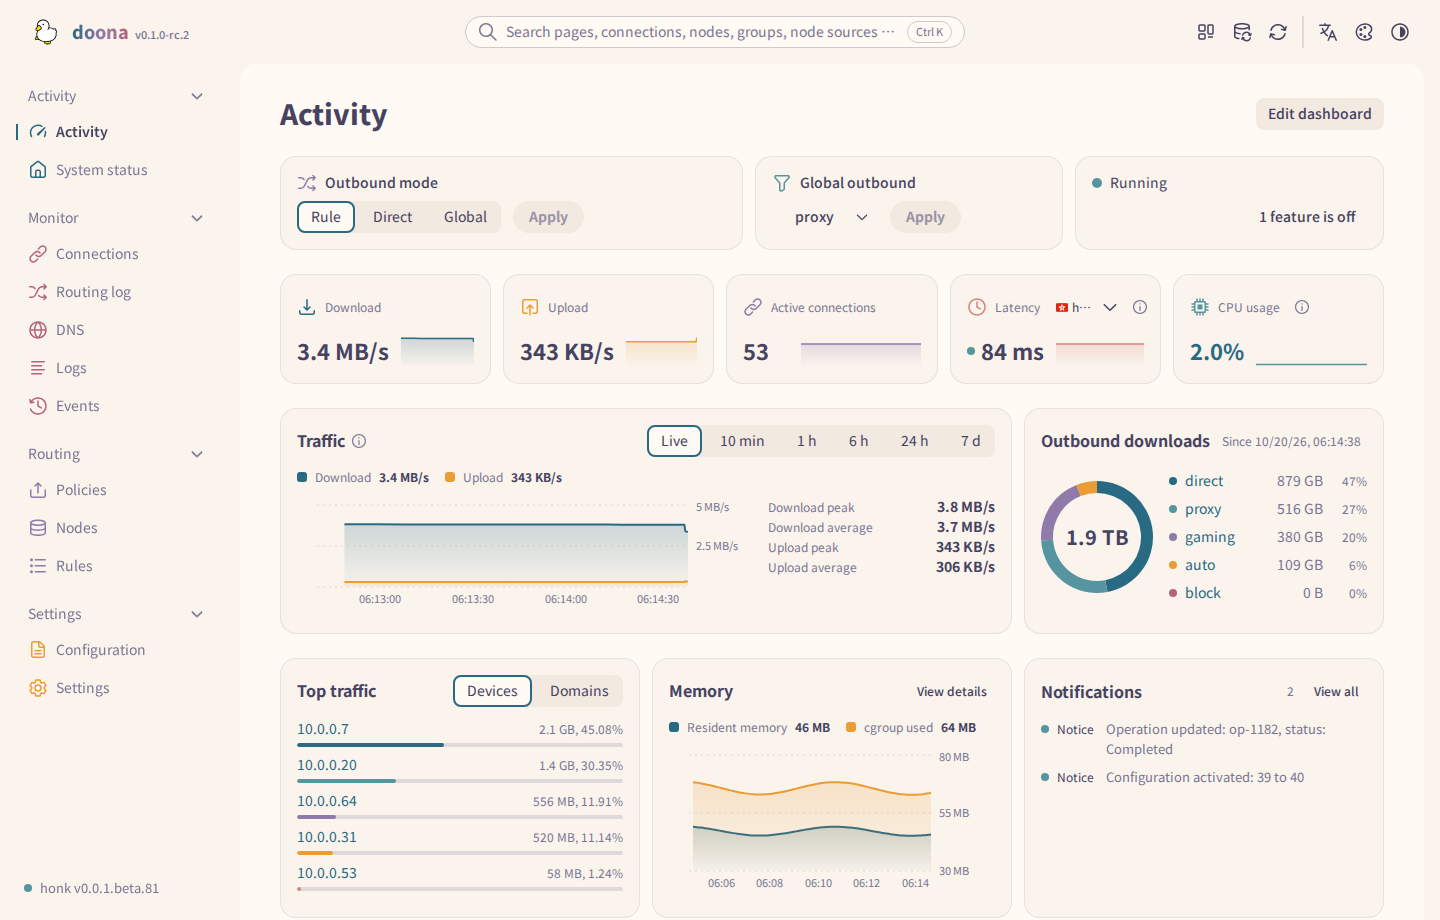
| Card or control | How to read it |
|---|---|
| Outbound mode and Global outbound | Follow switching mode to change them. |
| Download and Upload | Open the traffic view on Connections. Read any coverage warning before treating the values as totals for the gateway. |
| Active connections | Opens the connection list. |
| Latency | Follows a policy group's selected node. |
| CPU usage | Opens System status. |
| Top devices and domains | Ranks the returned connection sample. |
| Notifications | Combines repeated notices and shows their repeat count. |
Unavailable history or metrics depend on runtime status and history recording.
Select Latency to open its node on Nodes. Automatic follows the policy group with the most active connections; a manual group choice is kept in this browser and affects only this card.
CPU and latency trends need two samples. Failed latency probes leave gaps, and changing the selection restarts its series. Muted runtime figures retain the last successful reading while a read is failing.
The notification badge counts distinct folded notices, not their repeat counts. Stream ready remains on Events. A flow gap with reason recording_changed and no specific record marks a recording-history boundary; it does not necessarily mean records were lost.
Change the startup page under Appearance; Show trends on activity cards there controls activity-card trends.
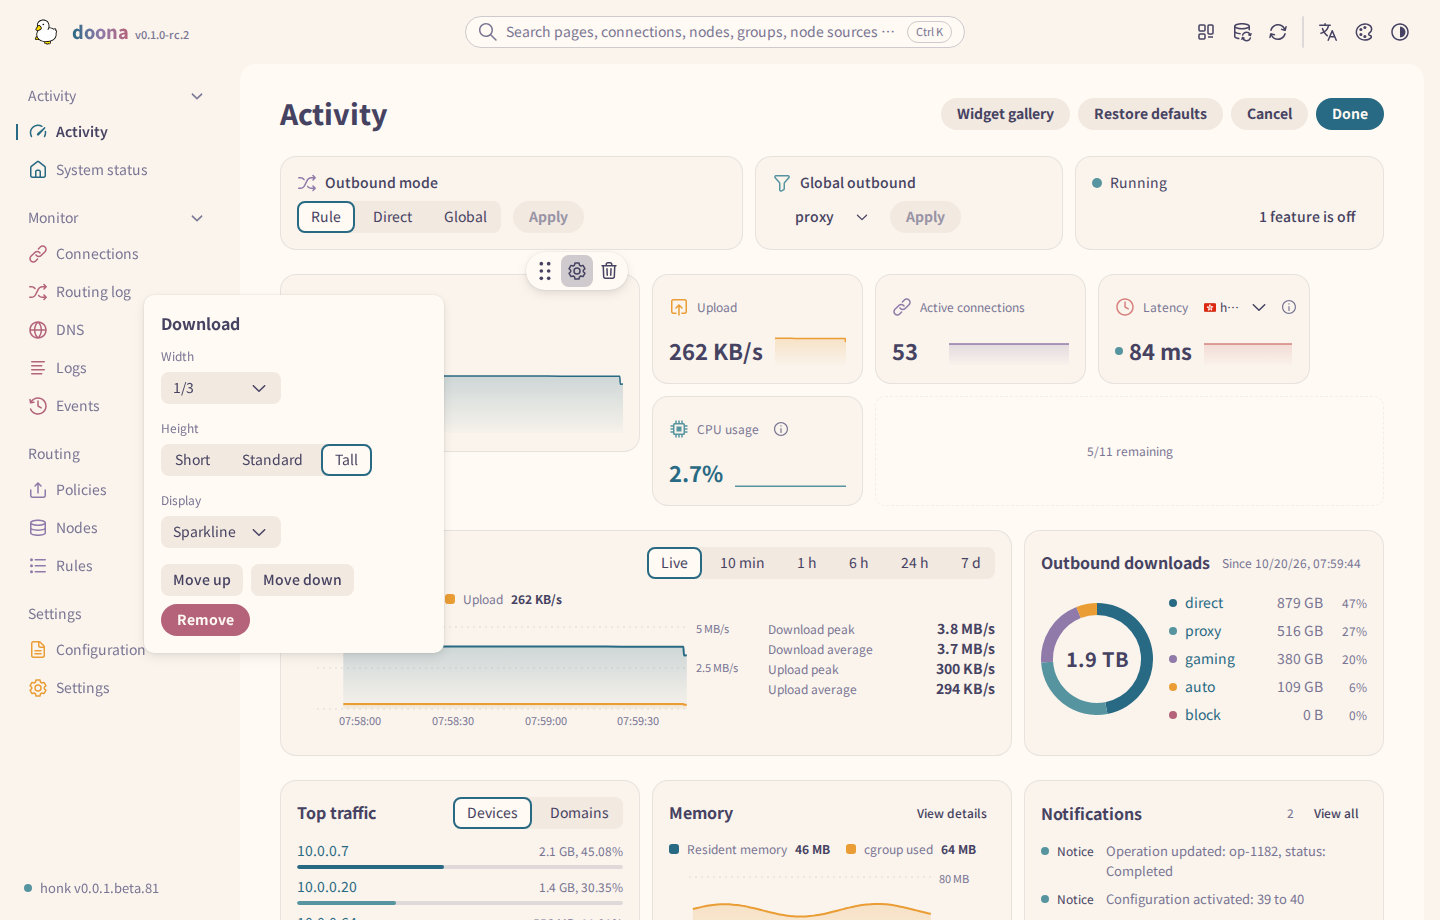
Use Edit dashboard to add, move, resize or remove cards. Done saves the layout. To discard edits, select Cancel and confirm. Layout storage has browser requirements.
You can place each widget at most three times. Available sizes depend on the widget, and resizing one card does not resize its neighbors. Removing a card offers Undo while the editor remains open.
The gallery includes Subscription quota, Outbound failures, Node availability and DNS latency. Memory can use a chart or a Sparkline value tile. Wide charts show peak and average statistics beside the chart. See Widgets for the shared dashboard and floating-panel gallery.
System status
Check the backend on System status before diagnosing an unavailable feature.
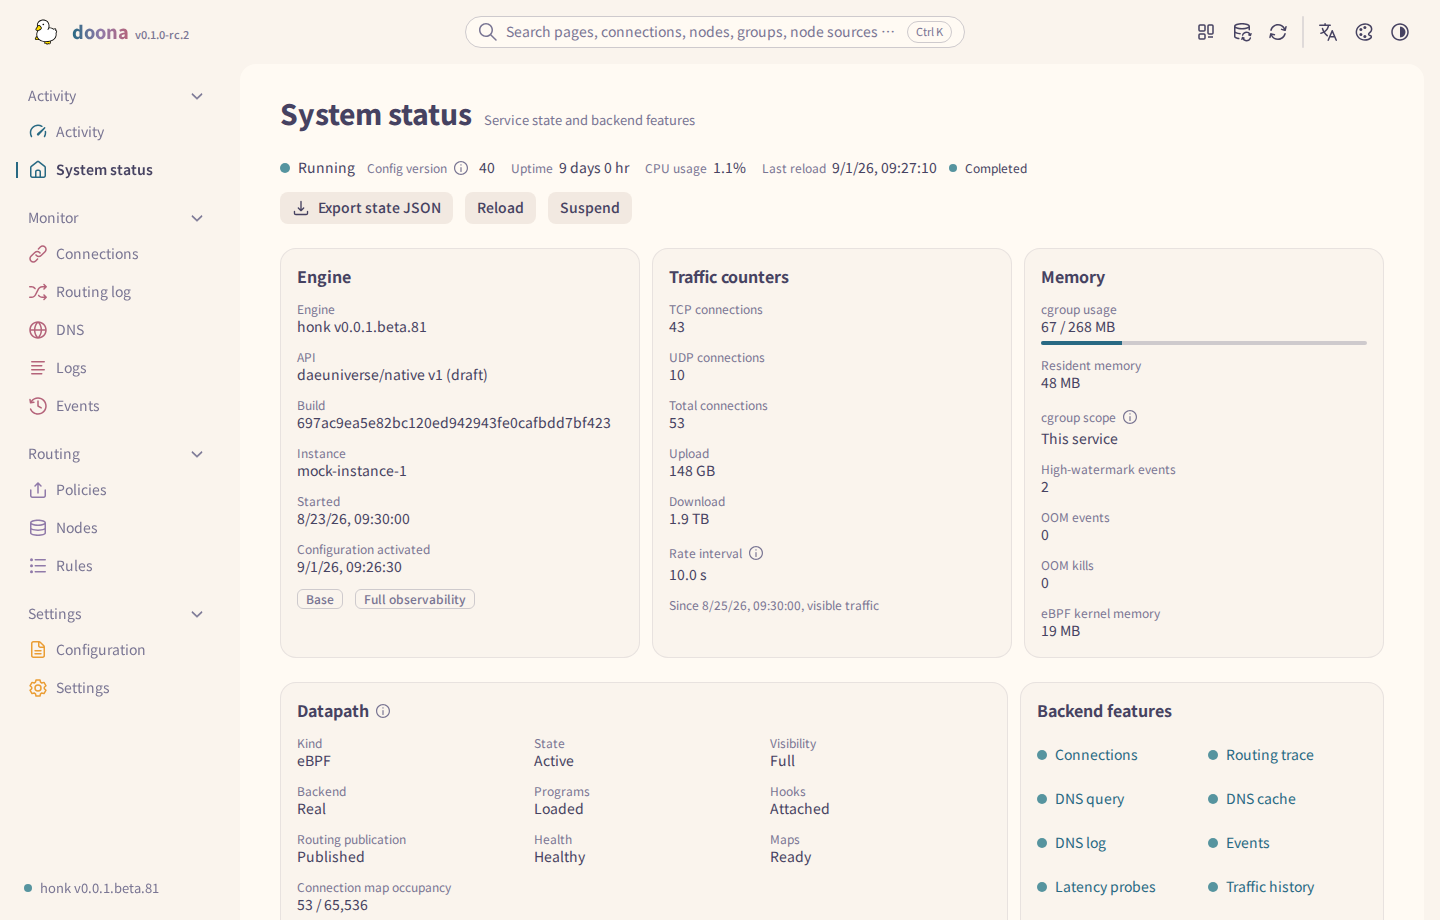
The header shows engine state, Config version, Uptime, CPU usage and Last reload. Config version identifies the active configuration revision, not its generation number.
| Section | What to check |
|---|---|
| Engine | Engine version and build, API and instance information. Also shows start and configuration activation times and the Base or Full observability profile. |
| Traffic counters | Counter start time and coverage, as well as upload, download and connection counts. TCP and UDP counts are separate; the rate interval gives the measurement period. |
| Memory | Reported process and cgroup memory. The cgroup meter compares usage with a nonzero limit; a zero or missing limit shows no meter. |
| Datapath | Kernel attachment checks and degradation warnings, including state database failures. Includes program, hook and map checks and an attachments table. |
| Backend features | Features advertised by this backend. Select an entry to open its corresponding page. |
| Features that are off | Each limitation's cause, the setting or startup option needed to enable it, and a link to its requirements. Includes rule and group editing, import and revision history, and geodata settings. Appears only when limitations exist. |
Select Export state JSON to save the reported state. For absent fields or actions, see status requirements and reload, suspend and resume requirements.
Status cards retain their space with placeholders while loading. Loading notices show progress indicators, and meters expose their names and value text to assistive technology.
Connections
Connections opens on Traffic. Choose List to inspect individual connections; links to a connection or a filtered list open that tab directly.
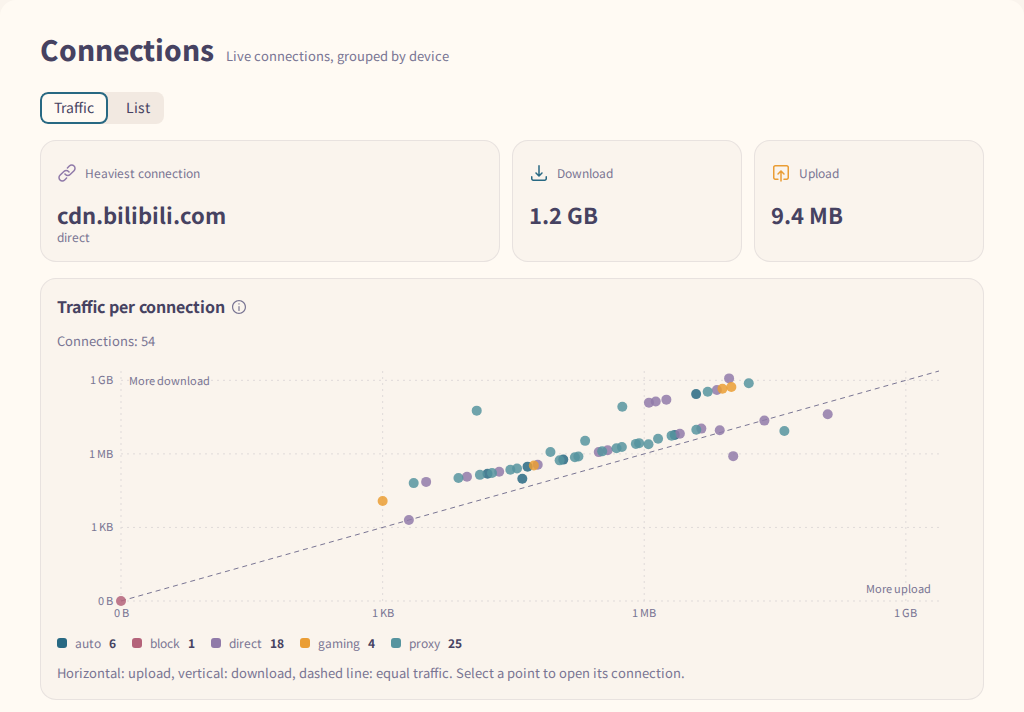
Select a chart point or list row to inspect the connection. Its details show the outbound, chain and matched rule when reported. Use the outbound investigation steps to open the rule or run a trace.
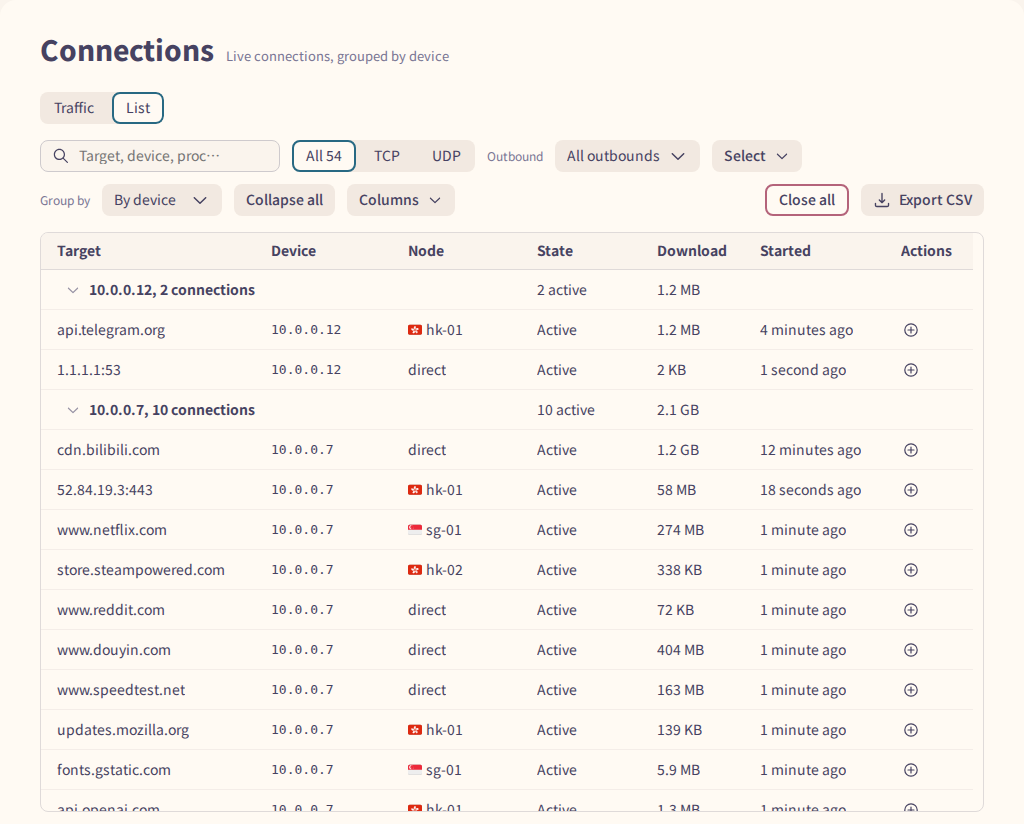
Filters also search the outbound, chain and rule. Export CSV exports the filtered list. Read truncation and visibility notices before interpreting an empty list; the connection requirements explain coverage and which connections you can close.
A row's add-rule icon is unavailable when the connection has no usable address or domain. More actions also offers Edit matched rule's outbound settings, View flow, Only this device and Close connection when supported.
Close all with only device and network filters targets every matching live connection, including connections opened after confirmation. An outbound, rule or text filter, a truncated list, or an exceeded bulk limit restricts closing to the listed IDs. The action skips kernel-direct connections.
Routing log
Routing log shows recorded flows in Map and Records. It depends on flow recording.
Select a path in Map, then use its flow-count button to open the matching records. In Records, select a row to read its routing trace. Read the reason when a trace is incomplete. View connection opens the associated live connection if it still exists.
Select Clear path filter to remove the pinned path. To create a rule from a recorded flow, use the add-rule icon on its record row; the detail panel does not contain that icon.
Recording settings opens the recording controls. See runtime changes for their scope and lifetime.
DNS
The available tabs depend on the backend's query, cache and recording capabilities.
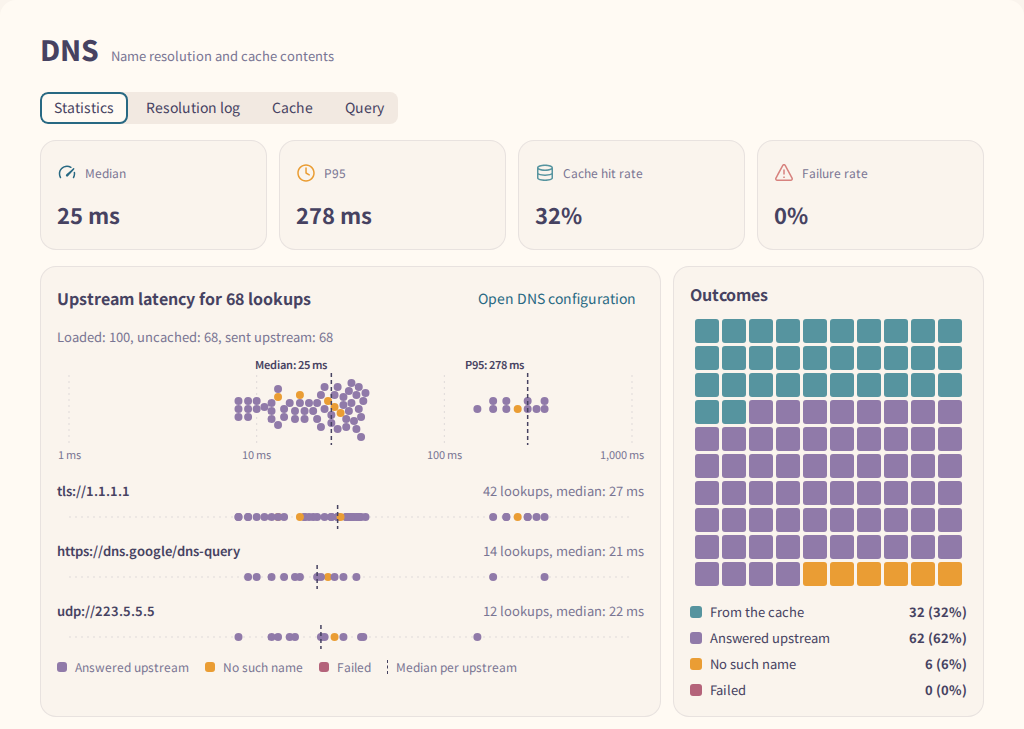
| Tab | Data and actions |
|---|---|
| Statistics | Summarizes the latest resolution-log page and cache information. Select a ranked domain to filter the log. |
| Resolution log | Select a row for the recorded request and answer. Export CSV exports loaded records, not the full history. |
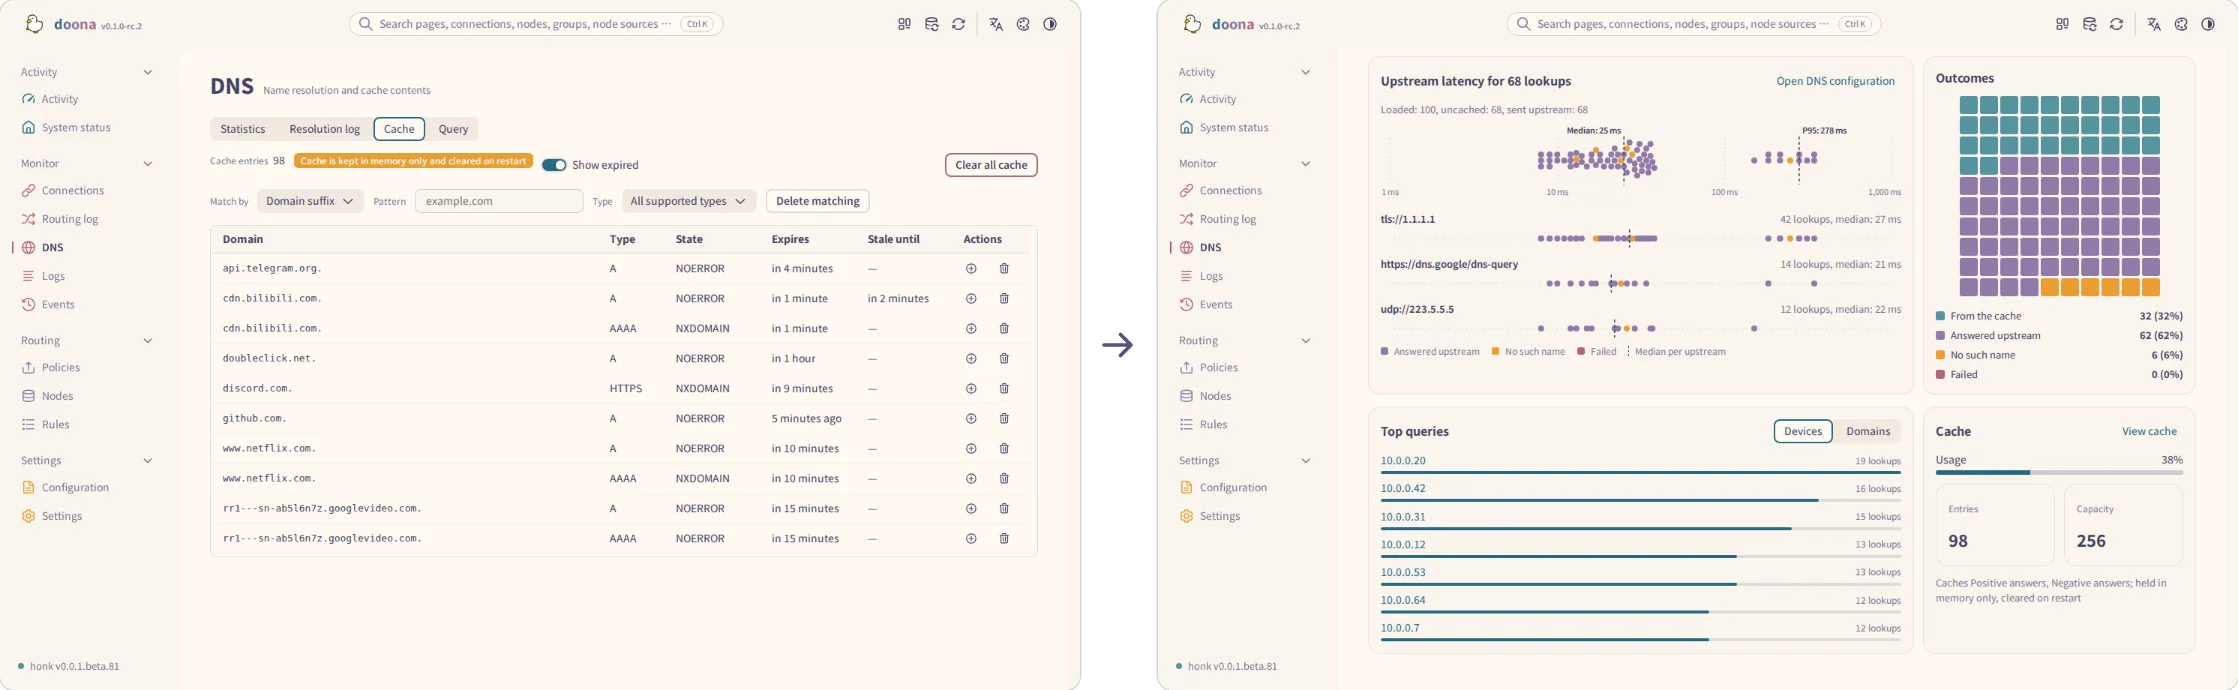
| Cache | Filter cached entries by name and record type. Show expired includes expired entries. Read the confirmation before deleting matches or clearing the cache. |
| Query | Runs a diagnostic lookup. Follow the query steps. These lookups do not appear in the resolution log. |
To create a rule from Resolution log, use a row's add-rule icon to create a DNS request rule for the exact domain. If DNS rules are unavailable, it opens a routing rule instead. Choose Domain suffix to include subdomains.
Cache filters support full names, suffixes, keywords and regular expressions, combined with a record type. A keyword matches anywhere: cdn matches cdn.example.com. The suffix cdn matches only cdn and names ending in .cdn.
Filtering also works without deletion support. Clear filters resets the criteria and removes the domain filter from the page URL.
When the cache reports memory-only storage, restarting clears its entries. The deletion confirmation shows the matching count, or the domain name and record type for name-based deletion. You cannot undo Clear all cache. No cache entries means the cache is empty; No matching cache entries means the current filters matched nothing.
Logs
Logs displays engine log records. Check log recording requirements if no records arrive.
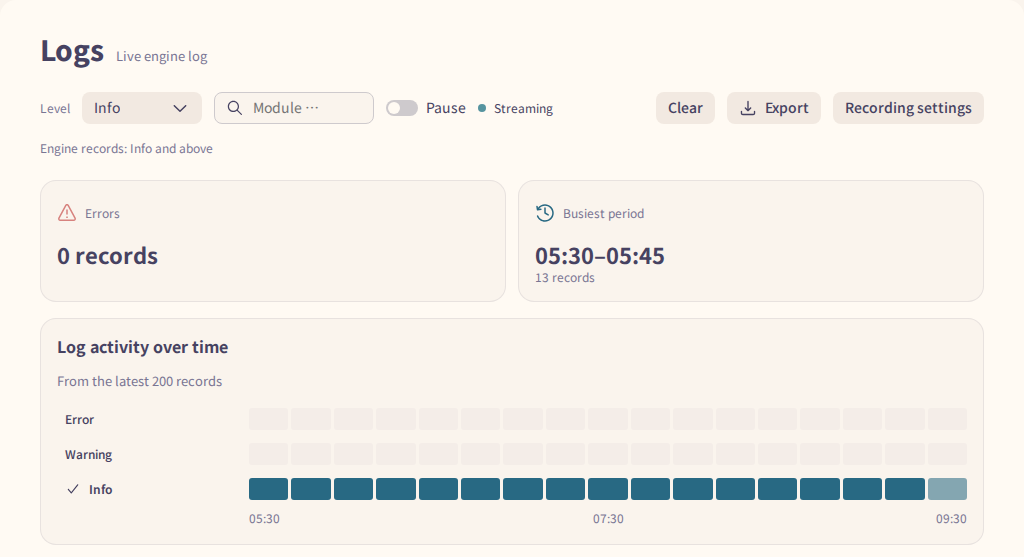
Use Level and Module to narrow the stream. Pause pauses display updates while the buffer retains only the newest records up to the page limit. Clear clears this page's records; Export downloads the received records, and Copy record copies one row in the same format used by Export.
The page marks levels below the engine's recording level as not recorded. Change the engine level through Recording settings; selecting a lower display filter cannot recover unrecorded messages.
A gap marker means replay could not recover some records after reconnecting. For messages from before recording began, use the service log.
Events
Events displays backend events, newest first. Check event requirements if the stream is unavailable.
Kind starts at Exclude runtime updates. Choose All kinds or a specific kind, then select a row for its details and related links. Export JSON exports the events currently shown; Copy record copies one event in the export format, without the surrounding array.
The list shows Time, Kind and Summary. Its toolbar reports connection state, retention limit and, when available, Resumes from the last position. Configuration activated offers View configuration when configuration is available; Flow records lost can offer View flow record and Recording settings.
After reconnecting, replay can recover retained events. A gap marker means the earlier events are no longer available for replay.
Source: doona upstream, licensed under CC BY 4.0.